Once again India stands on the threshold of a turning point in the long history of its economics. Optimism within the country is high. This article draws on the views of leading Consultants, Investors, and Analysts and presents a summary of the status, outlook, and imperatives.
By Vivek N. Joshi
Advisor, A-Joshi Strategy Consultants Pvt Ltd
Once again India stands on the threshold of a turning point in the long history of its economics. Optimism within the country is high. This article draws on the views of leading Consultants, Investors, and Analysts and presents a summary of the status, outlook, and imperatives.
Best estimates of the gross domestic product (GDP) are used as a measure of the economy, since the GDP is a widely accepted measure, despite its limitations. While doing so, it is useful to keep in mind that the GDP measurements may still be more attuned to the twentieth-century economy of production, and not for the 21st century economy of innovation, and digitized services.
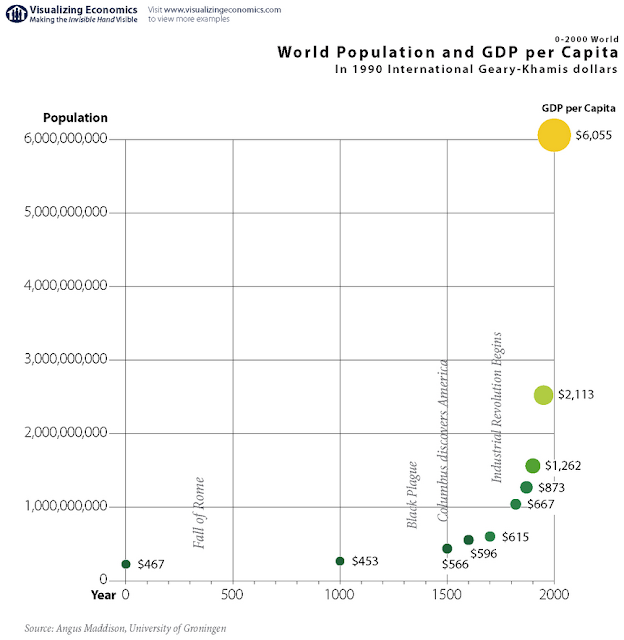
The chart below shows the estimate of the growth of the per capita income in the world over the last 200 years (CE1 to 2000 AD). Though the data is the best estimate, it is useful to note that the world was a very poor place until just after 1800 AD, when the Industrial revolution started significantly accelerating the growth of the global economy [1].
Chart Attribute: World population and GDP per capita /Angus Maddison, University of Groningen
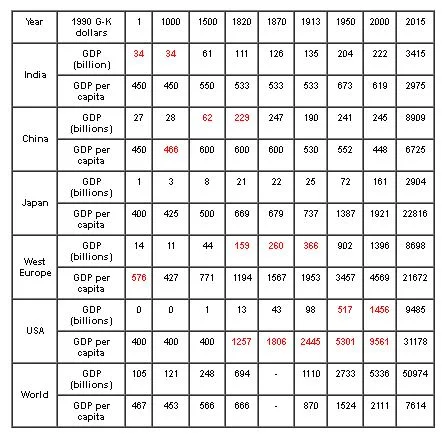
There is broad agreement that from 1 CE until about 1880 AD India and China were leaders in the size of the economy. India had the largest economy until about 1500 AD. The top ranking was taken by China from 1500 AD to about 1880 AD, France briefly in the late 1800s, and then the USA from 1890 to date. The UK, Germany or Japan was individually never the largest economies in the world, though UK had the highest per capita income for several years in the 19th century (AD 1800s). The table below summarizes the estimates of the GDP and the GDP per capita of various major regions [2]. The currency is the 1990 Geary-Khamis International dollars.
While historical numbers are estimates only, the margin of error is not expected to be large enough to challenge the conclusions that the world was abysmally poor until the Industrial Revolution. The largest numbers in the world (in a major country or region) in a specific period are highlighted in color for clarity.
While historical numbers are estimates only, the margin of error is not expected to be large enough to challenge the conclusions that the world was abysmally poor until the Industrial Revolution. The largest numbers in the world (in a major country or region) in a specific period are highlighted in color for clarity.
It is noteworthy that India and China, while having the highest GDP for a long time, almost never had the highest prosperity measured by the GDP per capita. Africa, Australia, and the Middle-East did not have the highest GDP at any time.
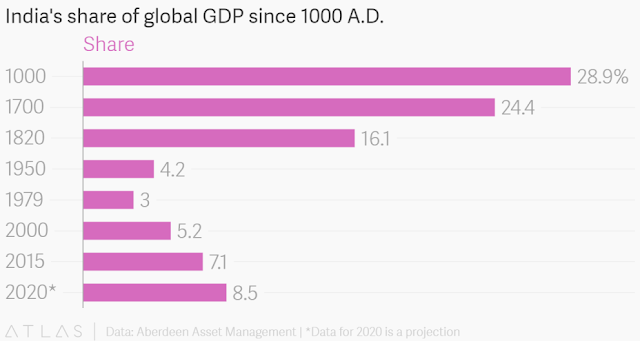
The share of the GDP of India in the world GDP over the past millennium is shown in the chart below and brings out the severe adverse impacts of lagging in technology development during the Industrial Revolution and that of colonization [3].
Chart Attribute: India's share of global GDP since 1000 A.D., Data: Aberdeen Asset Management *Date for 2020 is a projection
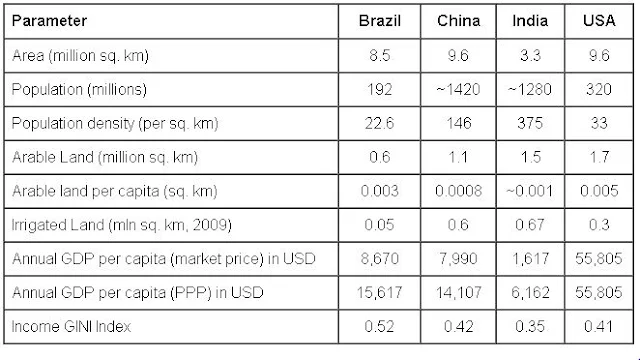
A comparison of some of the features of the economy of India with other large countries in shown in the table below [4]:
The slowdown in growth in the developed world is partially attributed to the decrease in Factor Productivity. Estimates of the non-farm labor productivity growth in USA during various periods are shown in the table below [5]:
There are inherent limitations in the estimation of productivity growth as the methods do not yet take into account several facets of the age of digitization. However, since productivity in India is less than 10% of the productivity in the USA, the limitations will not be relevant, and the gap in productivity underscores that India can develop rapidly if it merely adopts & customizes best practices.
India liberalized its economy in 1991 and has steadily made progress as seen in the chart above. It has gathered pace in the recent past, as seen in the chart below which compares key Emerging Markets on key parameters [6]:
It is important to consider economic inequality while looking at growth rates and for this Income Distribution and Gini Index (0-perfect equality, 1-perfect inequality) are useful measures. The global Gini rose from 0.49 in 1820 to 0.66 in 2000. This rise was not caused by widening inequality within a country, which fluctuated from 1820 to 1950, fell sharply from 1950 to 1980, and has been rising since 1980 back to the level of 1820. The rising global inequality has instead arisen from the rise in inequality between countries i.e., rich country-poor country gap. In 1820 UK had the highest prosperity (per capita income) at about five times more than the average poor nation. In comparison, USA now is about 25 times wealthier than the average poor country, based on per capita income.
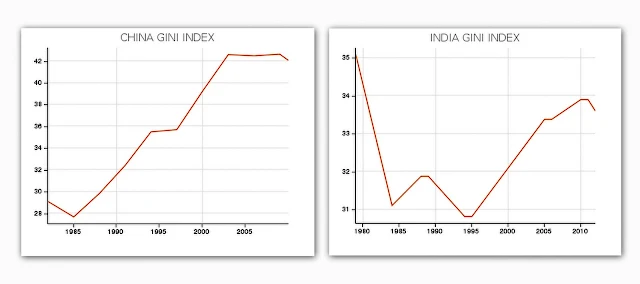
The Gini coefficient for between-country inequality was only 0.16 in 1820, rose sharply to 0.55 in 1950 and has remained steady until about 2008 AD. The driving force of inequality since 1820 has been the Industrial Revolution, in which the West surged ahead. The charts below show the trend of Gini Index for China and India [7,8]. Though the data is not available, it would be reasonable to conclude that India was not more egalitarian when the political system was a monarchy or colonial. The Gini index has increased less sharply for India even as the economy has grown and reduced absolute poverty.
Over the past 25 years, India has managed to reduce the percentage of its population living in absolute poverty from about 45% to about 22%. This is a creditable achievement. The absolute poverty line for this statistic is the standard defined by the World Bank at USD 1.75 (purchasing power parity basis) per day (~Rs. 32/day in the local currency). The government in India follows a similar standard based on the minimum calorific value of daily intake of food.
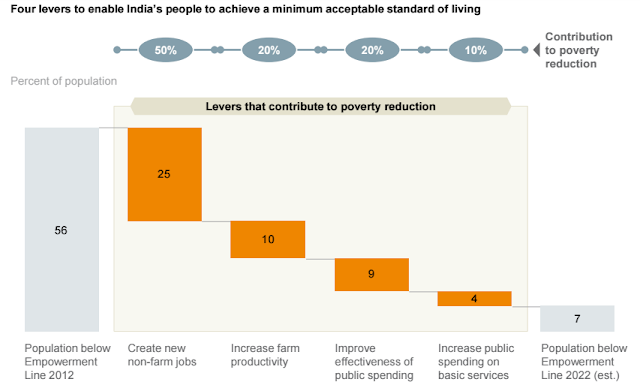
A much larger section of the population of India is, however, still deprived of a meaningful standard of living. This number may be as large as 57% of the population (about 1.28 billion now). Diligent & focused efforts are needed to lift such a vast population out of deprivation. Some of the steps required and their impact are summarized in the chart below [6]:
It is noteworthy that almost 50% of the benefits will come from creating non-farm jobs. This will also fulfill the requirement of providing jobs to 15 million entrants into the workforce every year. Nearly 57% of the population & more than 50% of the workforce depends on agriculture for a living. The comparative number in the USA is about 2% (Brazil ~15%).
Nearly 32 million jobs will need to be generated annually if a significant portion of the farm labor is to be re-skilled and moved to non-farm (& more remunerative) employment [4]. The government has taken several short-term and transformational measures at various levels, from policy making, enacting enabling laws & regulations, to execution & monitoring. Some of these are summarized below [6]:
Analysts and Consultants have summarized the various growth thrusts in multiple directions, like Make in India, Start-up India, Infrastructure, Digital India, JAM and many others [9].
Conclusion
India is on the move and the Indian economy is on the cusp of sustainable, egalitarian growth. The opportunities, drivers, and the mind-set are in place. There are two major roadblocks as it cruises along. The first is that the global economy could well be a sustained period of secular stagnation, with global growth significantly lower than the average of the past 25 years. The second block is the internal politics of India. While there is not much that India can do about global growth, it is hoped that politics will not once again derail the ride.
References
[1]. Max Roser (2015) – ‘GDP Growth over the Very Long Run’. Published online at OurWorldInData.org. Retrieved from: http://ourworldindata.org/data/growth-and-distribution-of-prosperity/gdp-growth-over-the-very-long-run/ [Online Resource].
[2]. Angus Maddison, Historical Studies of the World Economy, 1-2008 AD. www.gddc.net/maddison.
[3]. https://www.theatlas.com/charts/ByLbmbqq
[4]. Joshi, Vivek N., Agriculture in India: A Perspective from 1st Principles (May 20, 2016). IndraStra, 2016. Available at SSRN: http://ssrn.com/abstract=2782759
[5]. United States Department of Labor and http://www.bls.gov/lpc/
[6]. “India’s Ascent: Five Opportunities for Growth & transformation”, McKinsey Global Institute, Aug.2016
[7]. Bolt, J. and J. L. van Zanden (2014). The Maddison Project: collaborative research on historical national accounts. The Economic History Review, 67 (3): 627–651.
[8]. http://www.economist.com/news/finance-and-economics/21621908-what-impressive-work-economic-history-tells-you-about-inequality-breaking.
[9]. http://thinkingaloud.aberdeen-asset.co.uk/en/thinkingaloud/the-bigger-picture/india-the-giant-awakens
About the Author:
Vivek Joshi is an Advisor to A-Joshi Strategy Consultants Private Ltd based in Mumbai. He has international experience in various sectors and is an expert in Strategy, Innovation, and Venture Capital. Vivek has several publications and is an invited speaker on Strategy, 21st Century Challenges, and Management. He has a Bachelor’s Degree in Engineering, an MBA from India, and a Master’s Degree in Engineering from the USA. Vivek can be reached at www.expertstrat.com
Cite this Article:
Joshi, V. "THE PAPER | The Indian Economy : On a Cusp" IndraStra Global Vol. 02, Issue No: 08 (2016) 0044, http://www.indrastra.com/2016/08/PAPER-Indian-Economy-on-Cusp-002-08-2016-0044.html | ISSN 2381-3652


